
User guide · ~9 minute read
Using Power BI Director
Everything from download to your first bulk refresh, query, and analysis. The screenshots use sample workspace and model names — yours will show your own environment.
1 · Download and first run
- Download the ZIP from the latest release and extract
PowerBI-Director.exeanywhere in your user profile. - Double-click it. There is no installation and no admin prompt — it's a single portable file.
- First run only: Windows SmartScreen may show "Windows protected your PC." Click More info → Run anyway, and verify your download against the SHA256 checksum published with each release if you wish.
2 · Connect — two doors, pick either
Option A — Sign in (full experience)
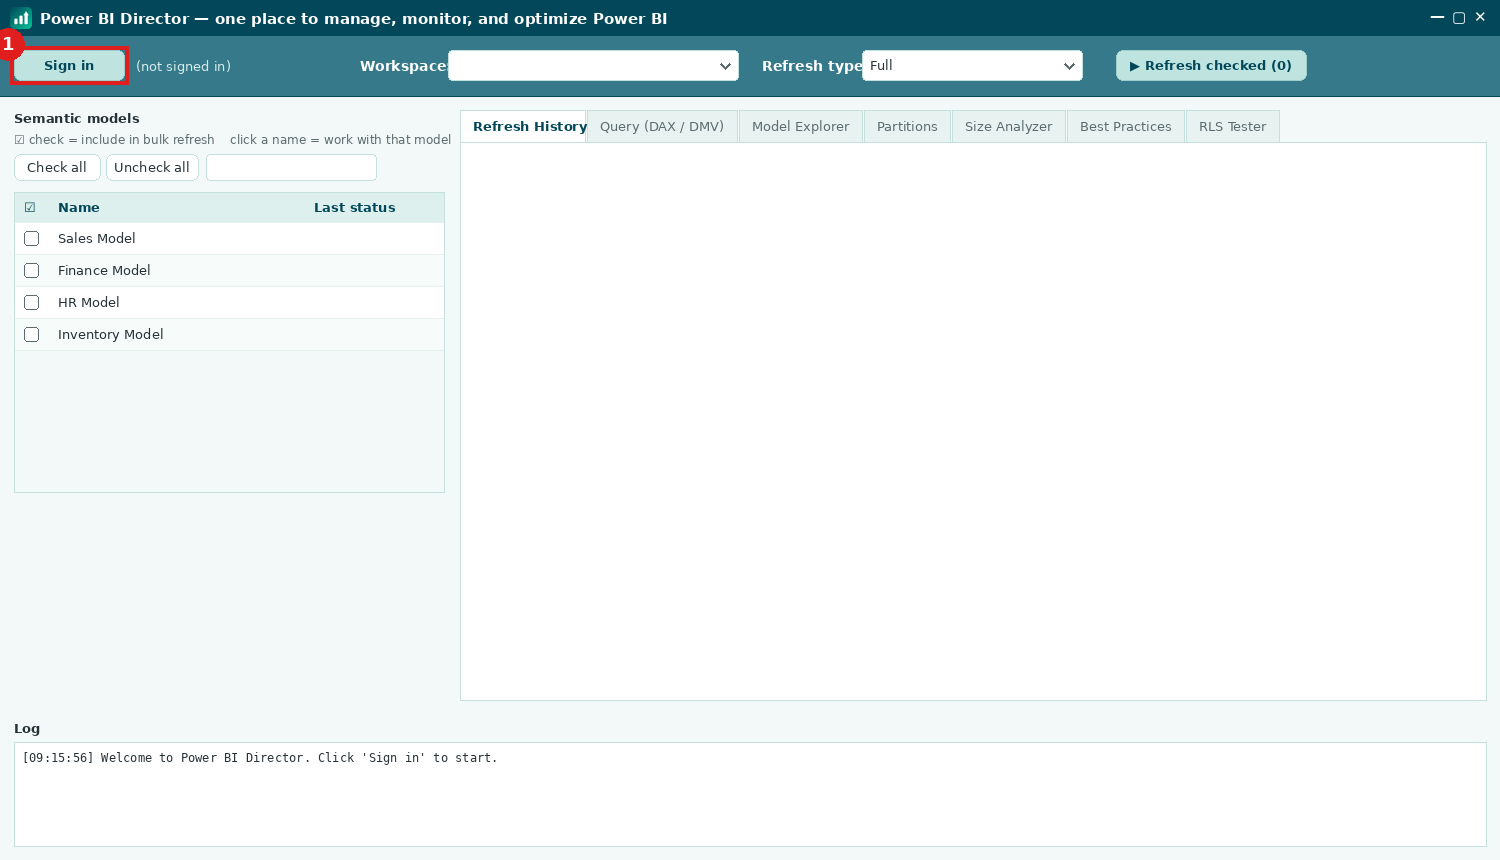
Click Sign in. Your browser opens and you authenticate directly with Microsoft using your own Power BI account — the app never sees your password. The button changes to Signed in ✓, your workspaces load, and every feature is available, including refresh history and cancel.
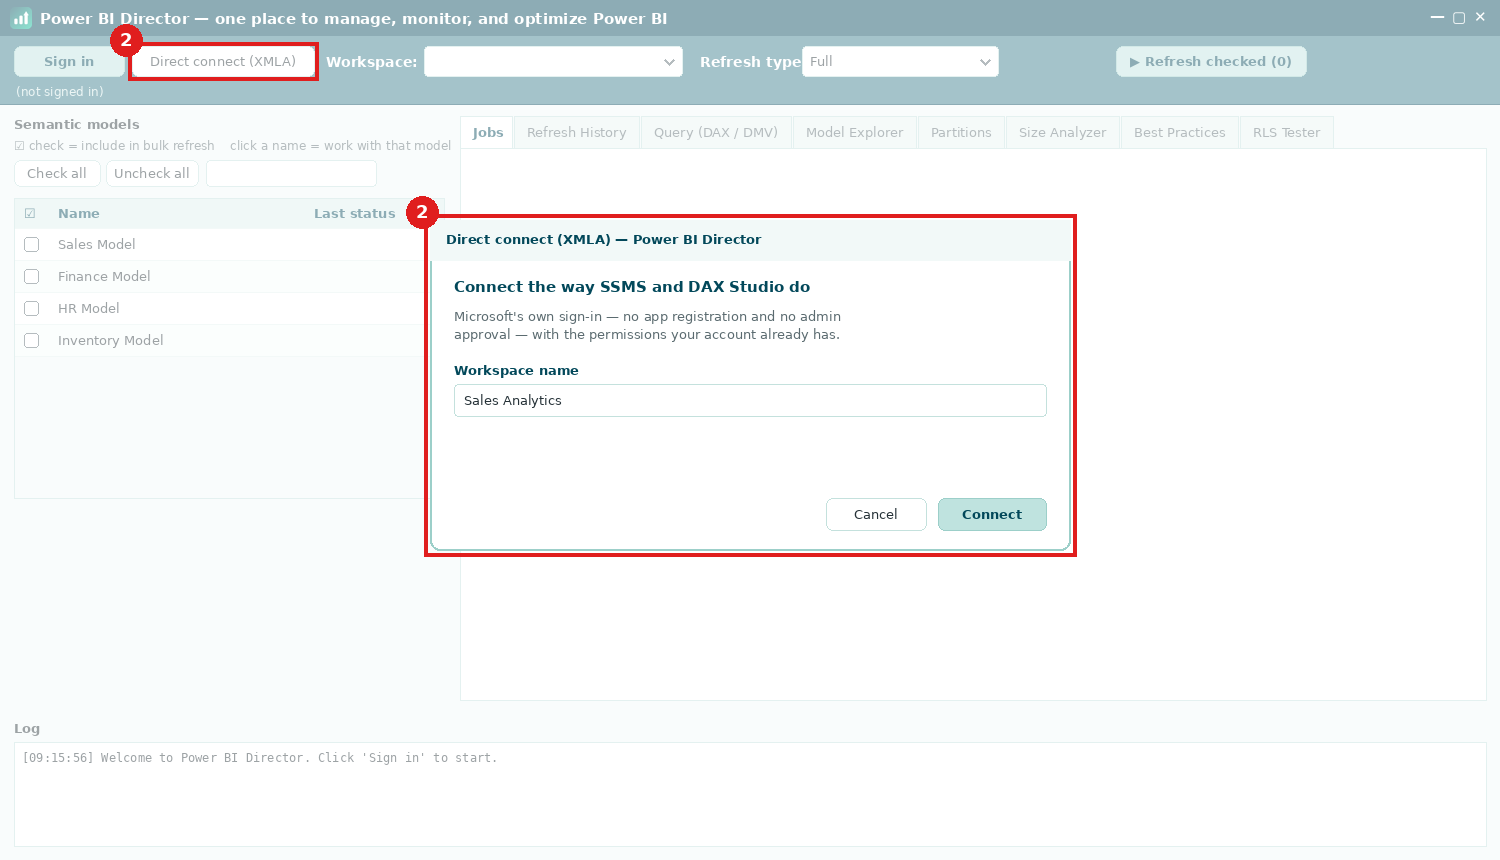
Option B — Direct connect (XMLA): the SSMS way, no approval needed
Click Direct connect (XMLA) and type the workspace name exactly as it appears in
Power BI (or paste its full powerbi:// XMLA address). Microsoft's own Analysis
Services sign-in appears — the same mechanism SSMS, DAX Studio and Tabular Editor use — and
you connect with the permissions your account already has. Nothing to register, nobody to ask.
- Works: bulk refresh, Query (DAX & SQL), Model Explorer, Partitions, Size Analyzer, Best Practices, RLS Tester.
- Paused in this mode: refresh history and cancel — those use the REST API. Press Sign in anytime to add them.
- Requires: the workspace on Premium / Fabric / PPU capacity — same prerequisite as SSMS.
3 · Pick a workspace
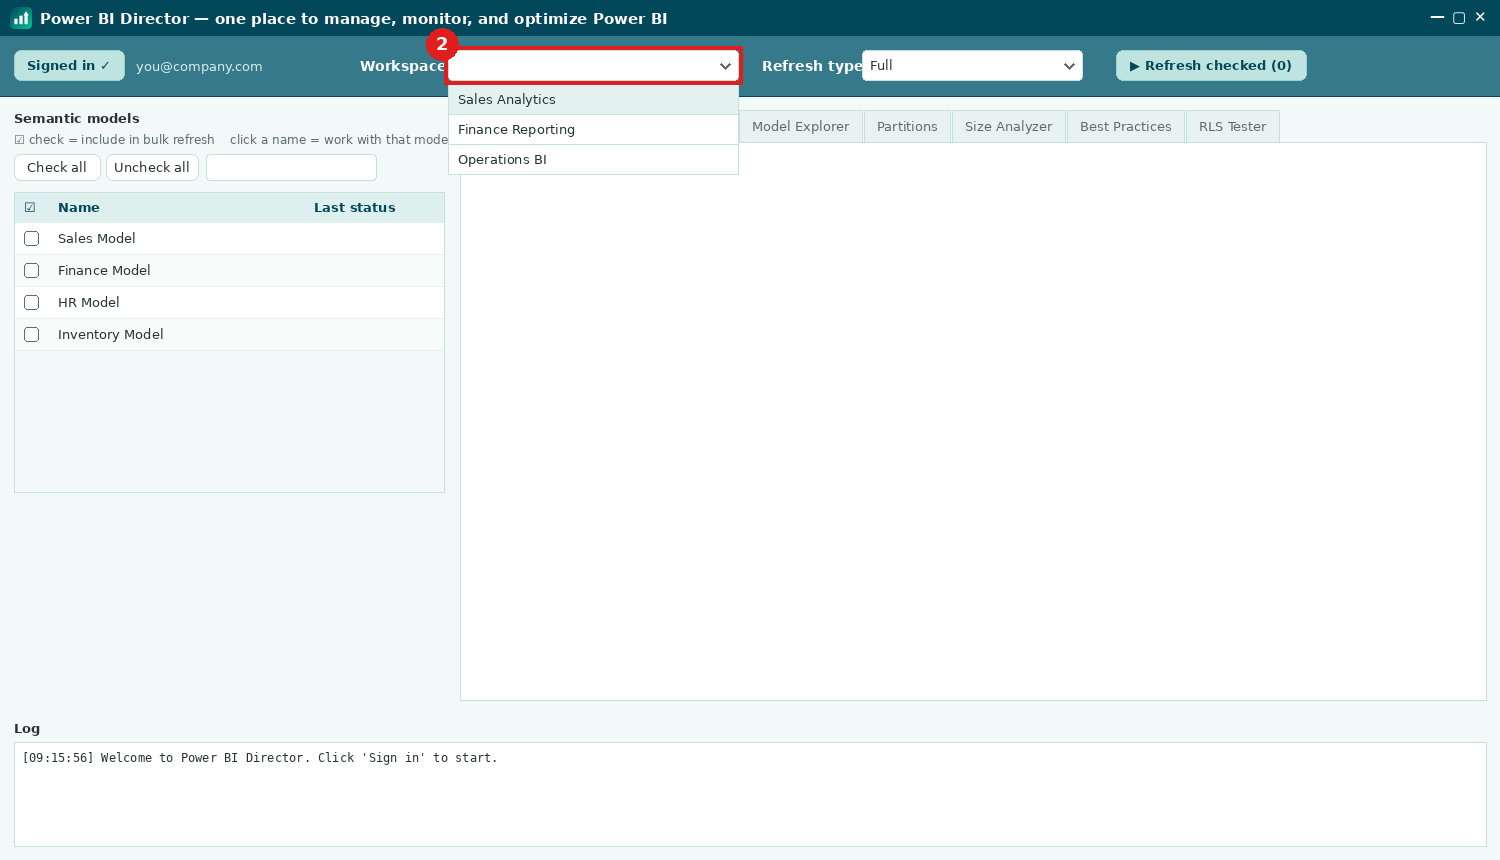
In Sign-in mode, open the Workspace dropdown — type to search if you have many. In Direct mode you already named it. Either way, the workspace's semantic models list on the left.
4 · The model list — one rule to remember
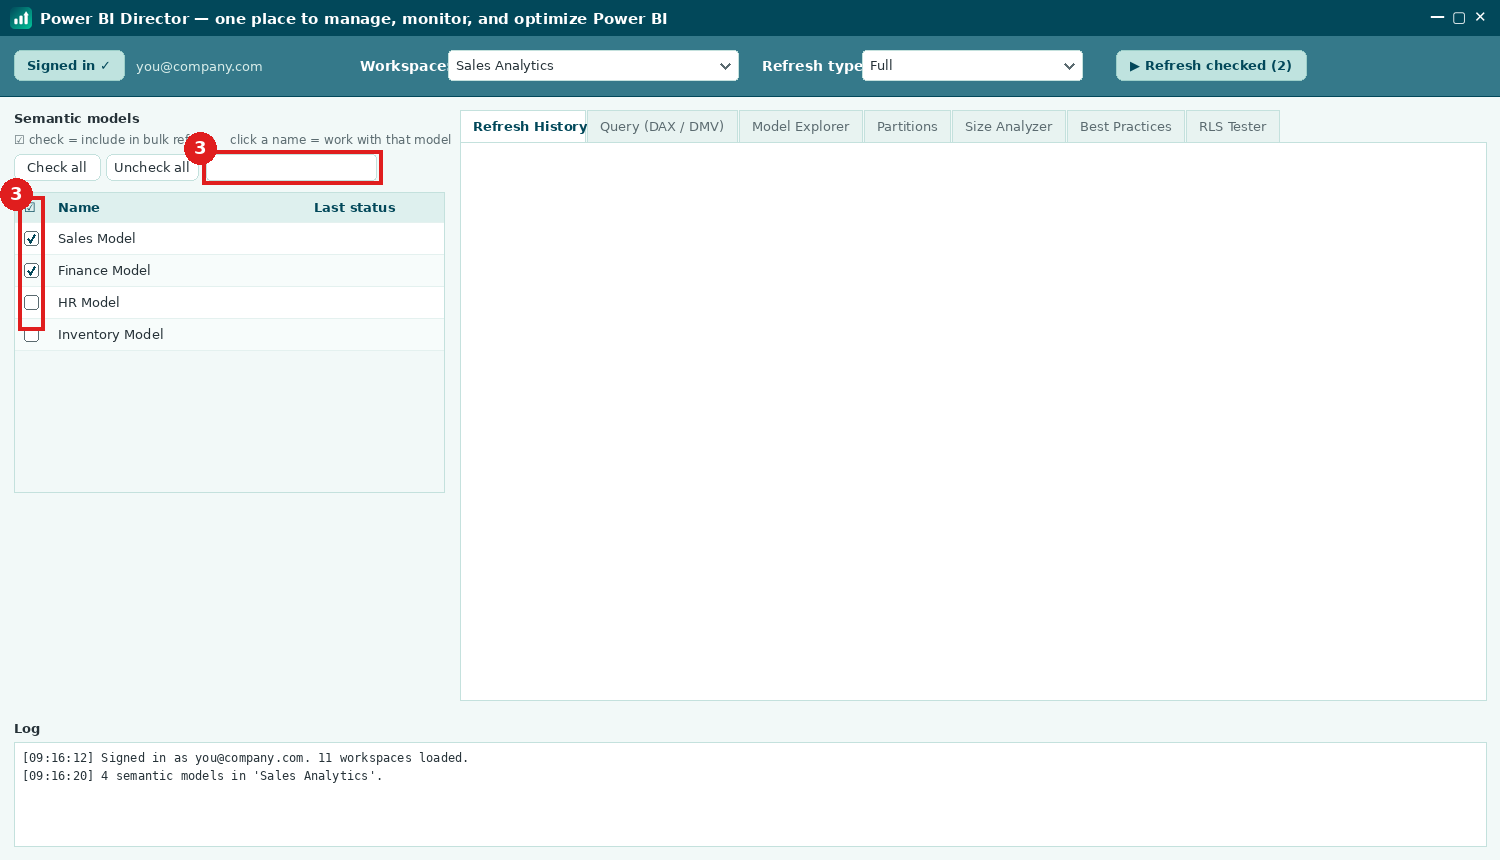
- Tick the checkbox ☑ = include that model in the next bulk refresh.
- Click the model's name = make it the working model for every tab: history, query, explorer, partitions, analyzers.
The filter box narrows long lists instantly; Check all respects the filter and skips internal models that can't be refreshed.
5 · Bulk refresh and the smart queue
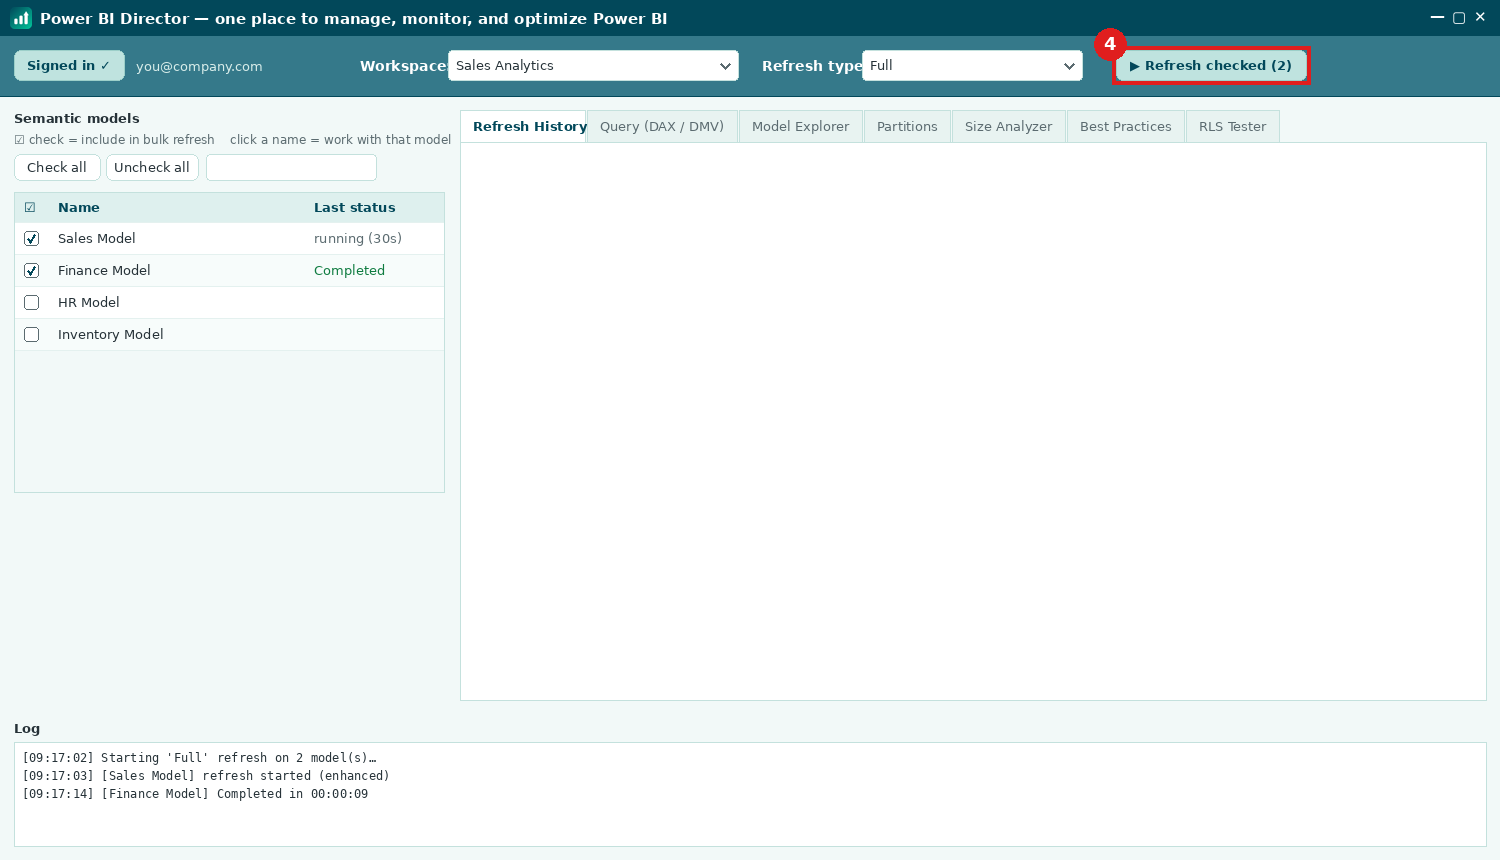
Tick your models and press ▶ Refresh checked (the button shows a live count). Up to three models refresh in parallel — a deliberate cap that protects your capacity — and the rest show queued, starting automatically as slots free up. Statuses update live: queued → running (with elapsed time) → Completed or Failed. The button never locks: you can keep starting more models while others run, and models already refreshing are skipped, never double-triggered.
6 · Refresh history (Sign-in mode)
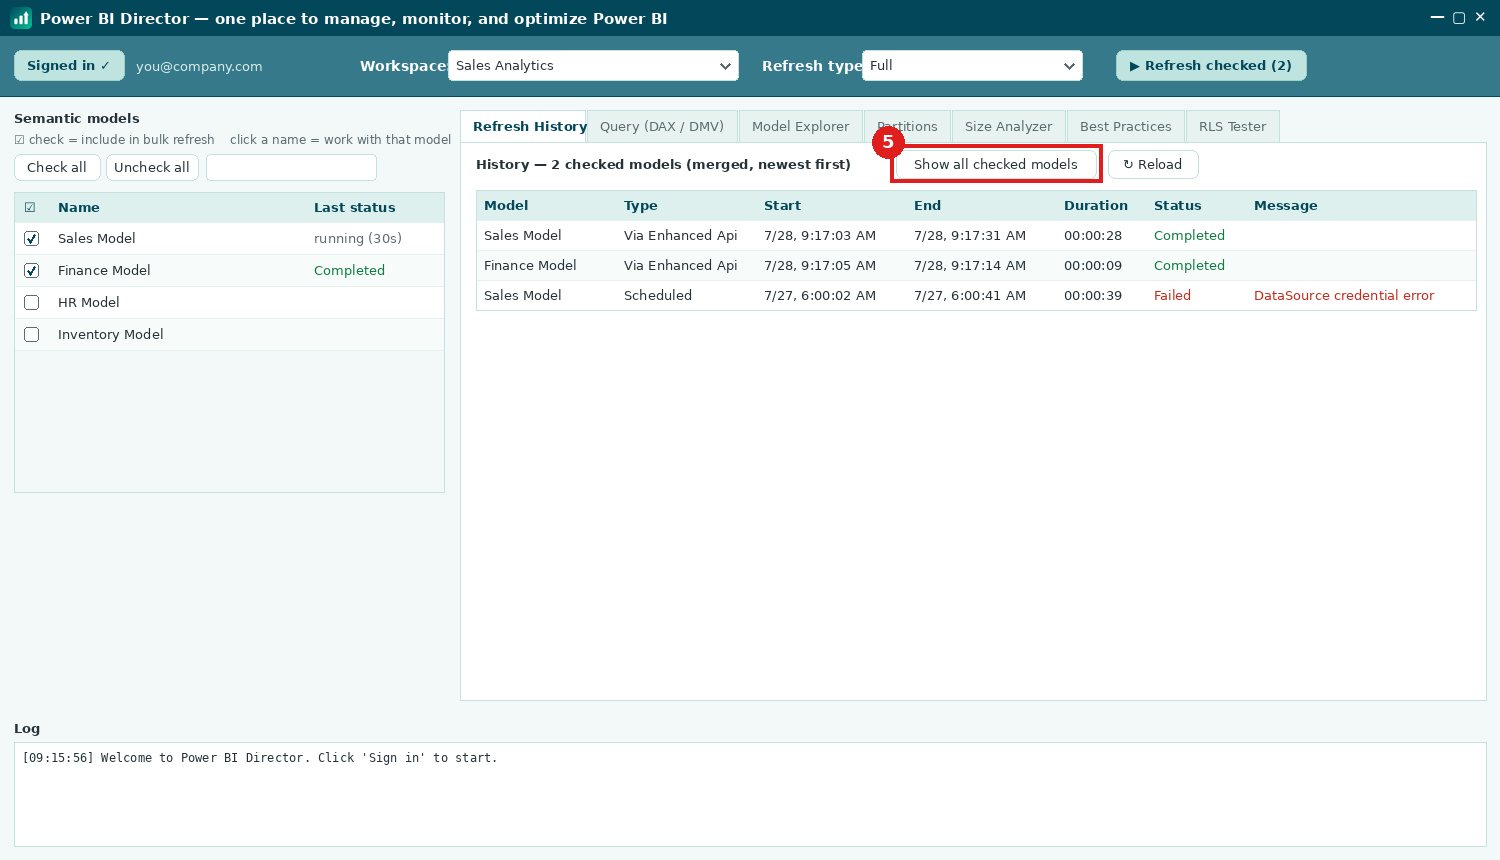
Click any model and its history loads instantly — type, local times, duration, status, and a readable error message (hover for full detail). Press Show all checked models for a merged, newest-first view across every checked model — a cross-model view the portal doesn't offer. Select an in-progress row and press Cancel to stop it.
7 · Query — in DAX or plain SQL
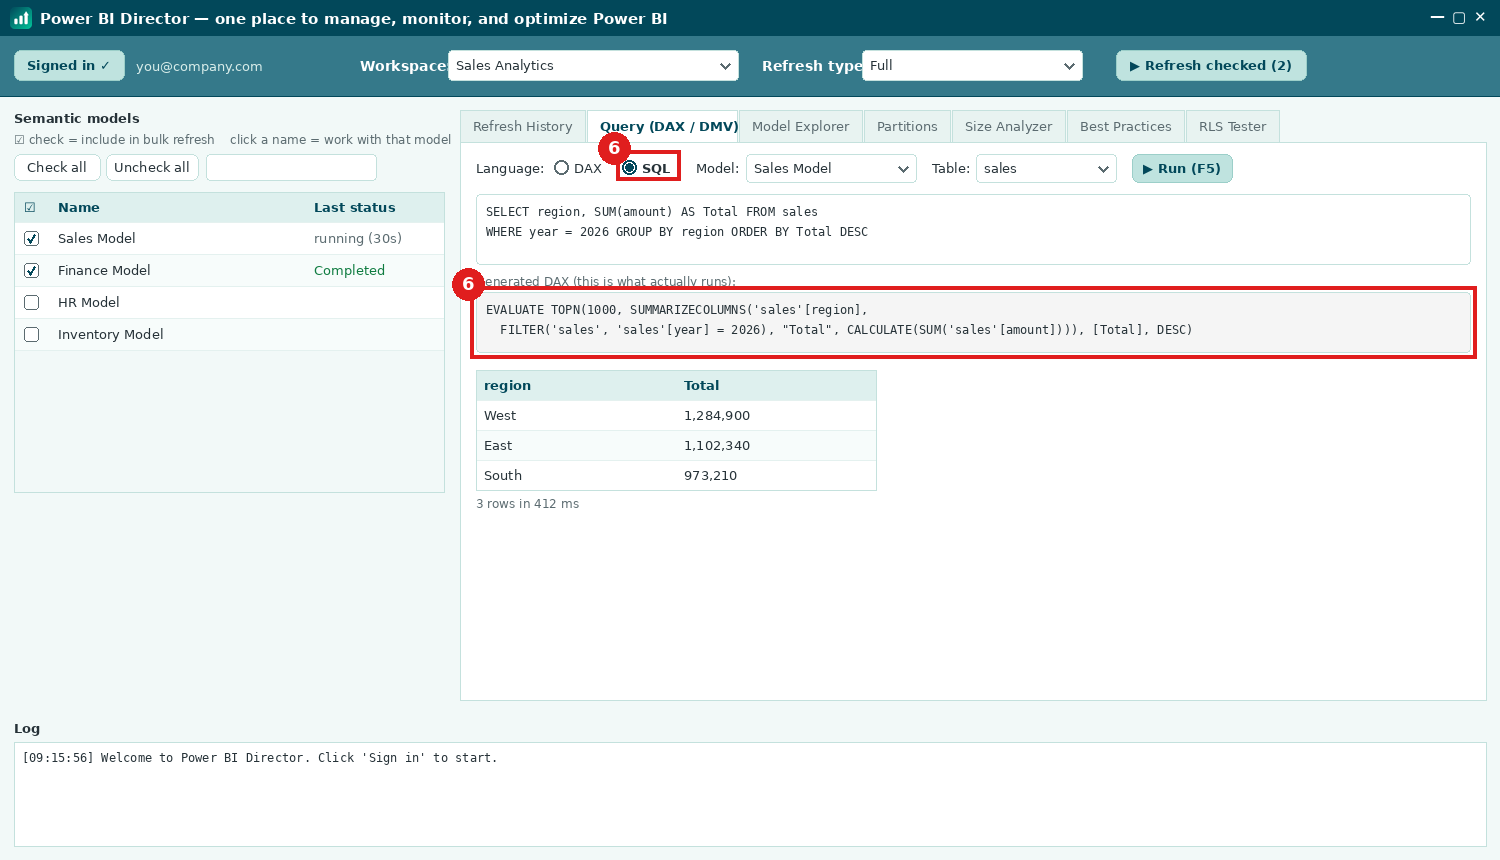
The Query tab runs against whichever model is selected (the picker shows it explicitly).
- DAX / DMV — any
EVALUATE …query or$SYSTEMDMV. The Table dropdown inserts a ready-made top-100 query; F5 runs. - SQL — write a familiar
SELECT … WHERE … GROUP BY … ORDER BYand the generated DAX appears live as you type, then executes. Supported: TOP/LIMIT, AND filters, SUM/COUNT/AVG/MIN/MAX. JOINs and OR aren't — the error says so, and DAX mode is one click away.
8 · The deeper tabs
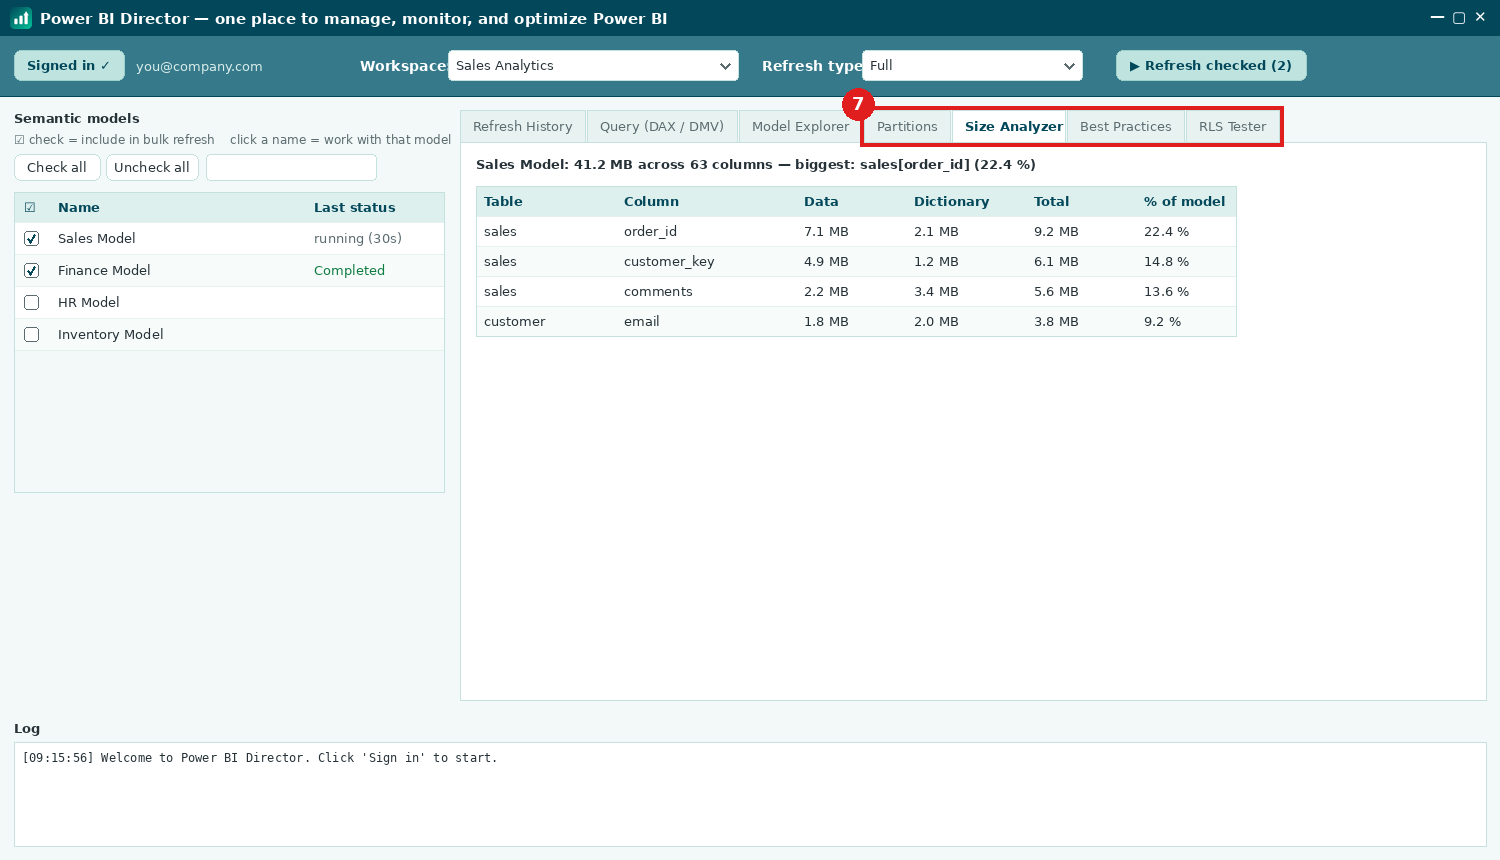
- Model Explorer — tables, columns, measures, partitions and last-refresh times; double-click a table to query it.
- Partitions — every partition with its incremental date range; check specific ones and refresh just those (capacity XMLA endpoint must be Read/Write; the app warns before writing).
- Size Analyzer — per-column memory: data + dictionary size, largest first, with % of model.
- Best Practices — curated rule scan with a concrete fix per finding, color-coded Error / Warning / Info.
- RLS Tester — pick a role, see its filter DAX, compare per-table row counts with vs. without the role: Full, Filtered, or Blocked.
Requirements
| Feature | Needs |
|---|---|
| Refresh, history, cancel (Sign-in mode) | Any workspace you can contribute to — Pro is enough (API limit: 8 refreshes/day/model on shared capacity) |
| Direct connect, Query, Explorer, Size, Best Practices, RLS | Workspace on Premium / Fabric / PPU capacity (XMLA read) + Build permission on the model |
| Partition refresh | The above, plus capacity XMLA endpoint set to Read/Write |
Troubleshooting
| You see | It means |
|---|---|
| "Windows protected your PC" | Unsigned app, first run — More info → Run anyway. |
| "Approval required" at sign-in | Your organization gates third-party apps. Request the one-time admin approval — and use Direct connect (XMLA) meanwhile. |
| Blank white sign-in window (Direct connect) | Corporate WebView2 rendering restriction. Click once in the window's middle — sign-in completes via SSO. |
| A model shows "queued" | Working as designed: max 3 refresh at once; it starts automatically when a slot frees. |
| XMLA refresh running, but nothing in the portal's history | Normal: XMLA refreshes appear there only after completion, as "Via XMLA Endpoint". |
| "XMLA unavailable here…" | That workspace isn't on Premium/Fabric capacity — Sign-in-mode refresh & history still work. |
| "You need Build permission…" | Ask the model owner for Build access. |
| "not refreshable" status | Internal model (e.g. usage metrics) — excluded from refresh by design. |